This week I made a bit of progress with my garden monitoring system and figured out how to add a bunch of sensors connected to an ESP8266 that sends updates to my MQTT server. The hardwear is still being finished, but basically I am using four I2C expanders to add 16 Analog inputs to the NodeMCU along with a few other sensors attached to digital pins. This is all solar powered and I just got a controllable watering system that is working well. I will cover all of that once I have my system up and running.
Today I have been playing around with Home Assistant to make the user interface that I will use to help figure out and test automations later.

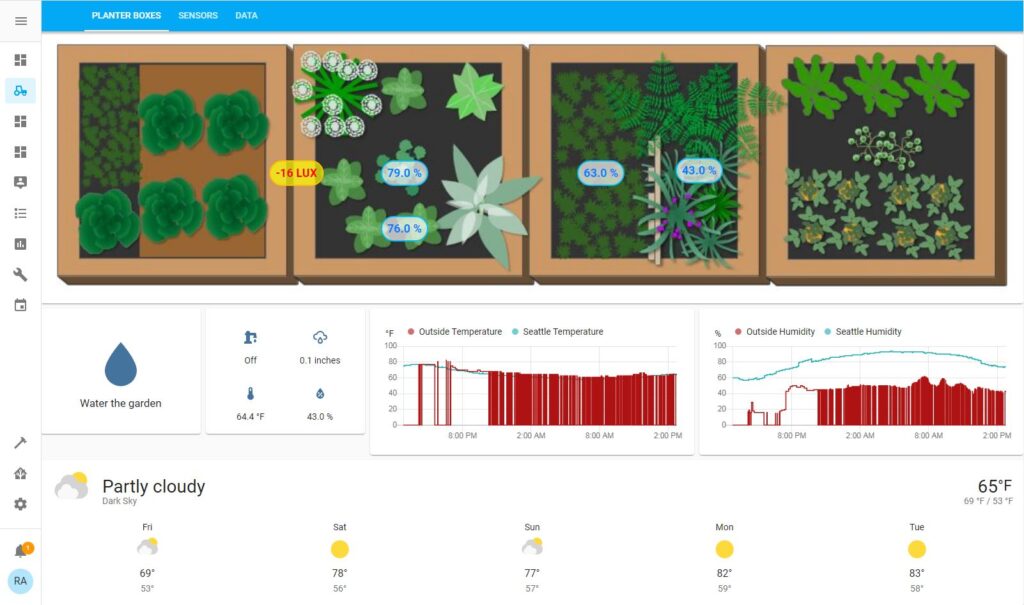
The first tab is a basic overview of the planter boxes with sensor data displayed over the aria that the actual sensor is placed. This also has a button to run a script that pulses water to the garden boxes so that the soil soaks up the water and a switch that lets you manually control the water pump. Though the pump switch is just for my testing because if you just turn the pump on it tends to flood the boxes that lets a bunch of water dripping out from the bottom and it is better for the script to pulse water over time. After that there is a graph with local weather report data along with data from my DHT11 sensor and the forecast for the week.

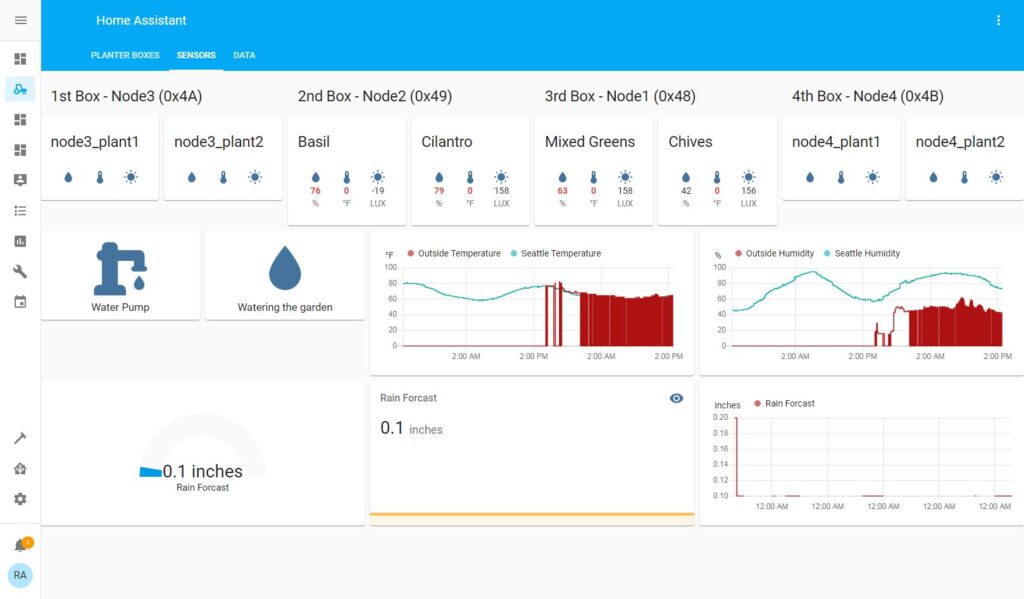
The Sensors tab shows each of the sensor readings using the Plant Status cards for Lovelace so that I can set alert triggers later for things like low water levels, freezing temperatures, or over exposure to sunlight. This tab also shows predicted rainfall for the day in inches. This information will be used to tell the system if it needs to water the garden or let nature do its thing.

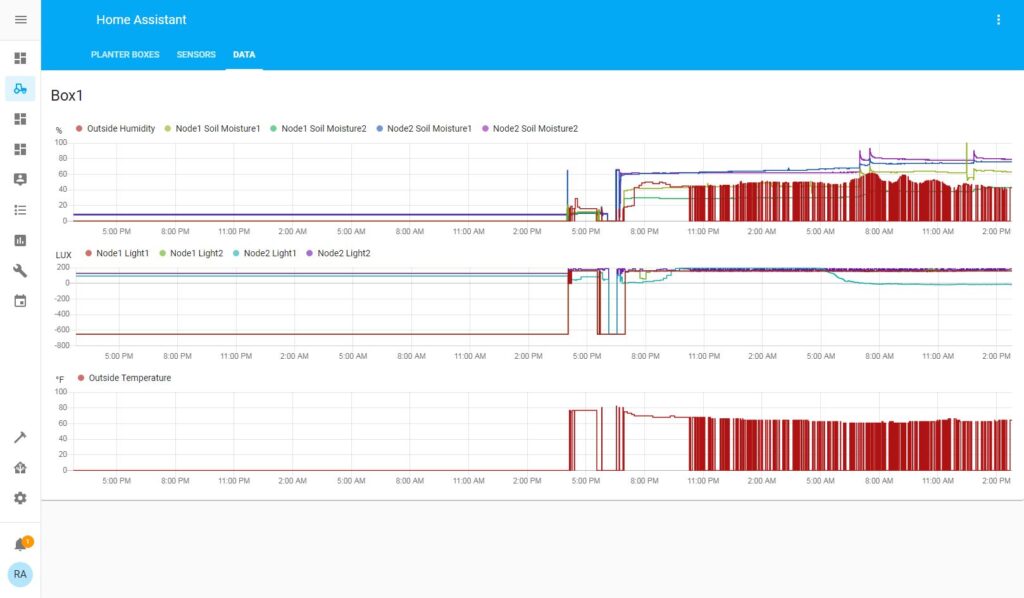
Now we get to a lovely display of data graphing that would make any researcher proud. The first graph compares the air humidity with the soil humidity for the last 48 hours so you can see how the day’s heat affects the soil moisture. If you look closely on the right side of this graph, you can see two spikes where the water pump did it’s thing. The next graph is for the light sensors, but I only have one connected right now. The last graph will show the soil temperature for each of the planter boxes as soon as I get those wired into the ESP8266.
Later I will be adding a water level sensor that tells me to fill the water tank and will not let the pump run if the water level gets below the pump’s intake level.
I am hoping to have more about this project later next week including how I built the electronics and 3D printed a solar radiation shield to get more accurate weather data.


